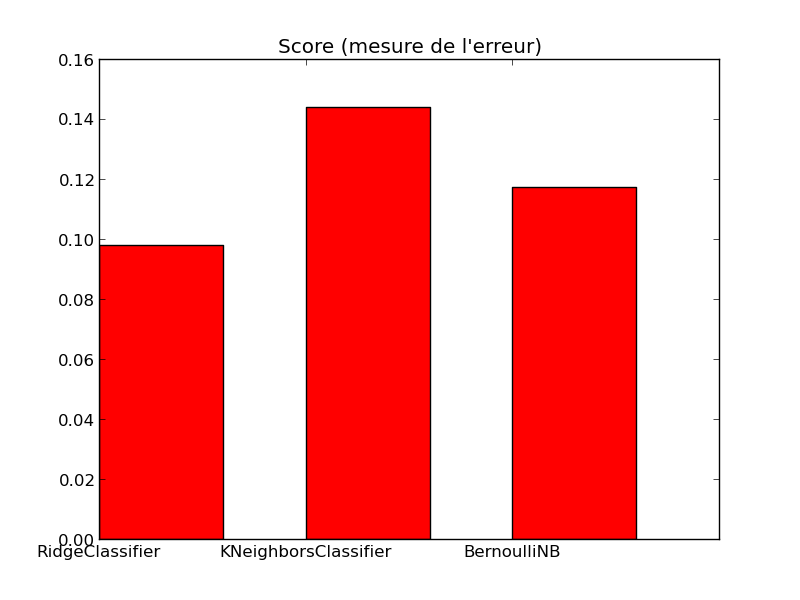
7.2.2.1. Example de classification de documents texte
Python source code: plot_document_classification.py
import numpy as np
import pylab as pl

from sklearn import datasets
from sklearn.feature_extraction.text import TfidfVectorizer
from sklearn.linear_model import RidgeClassifier
from sklearn.naive_bayes import BernoulliNB
from sklearn.neighbors import KNeighborsClassifier
from sklearn import metrics


###############################################################################
# Load some categories from the training set
categories = [
    'alt.atheism',
    'talk.religion.misc',
    'comp.graphics',
    'sci.space',
]

data_train = datasets.fetch_20newsgroups(subset='train', categories=categories)

data_test = datasets.fetch_20newsgroups(subset='test', categories=categories)

categories = data_train.target_names    # for case categories == None

# split a training set and a test set
y_train, y_test = data_train.target, data_test.target

vectorizer = TfidfVectorizer(sublinear_tf=True, max_df=0.5,
                             stop_words='english')
X_train = vectorizer.fit(data_train.data)
X_train = vectorizer.transform(data_train.data)

X_test = vectorizer.transform(data_test.data)

feature_names = np.asarray(vectorizer.get_feature_names())


###############################################################################
# Benchmark classifiers
def benchmark(clf):
    clf.fit(X_train, y_train)
    pred = clf.predict(X_test)

    print

    score = 1 - metrics.f1_score(y_test, pred)
    print "error:   %0.3f" % score

    if hasattr(clf, 'coef_'):
        print "top 10 keywords per class:"
        for i, category in enumerate(categories):
            top10 = np.argsort(clf.coef_[i])[-10:]
            print "%s: %s" % (category, " ".join(feature_names[top10]))
        print

    print metrics.classification_report(y_test, pred,
                                        target_names=categories)

    print "confusion matrix:"
    print metrics.confusion_matrix(y_test, pred)

    print
    clf_descr = str(clf).split('(')[0]
    return clf_descr, score


results = []
for clf, name in (
        (RidgeClassifier(tol=1e-2, solver="lsqr"), "Ridge Classifier"),
        (KNeighborsClassifier(n_neighbors=10), "kNN")):
    print '_' * 80
    print name
    results.append(benchmark(clf))

results.append(benchmark(BernoulliNB(alpha=.01)))


# make some plots

clf_names = [r[0] for r in results]
score = [r[1] for r in results]

pl.title("Score (mesure de l'erreur)")
pl.bar([0, 1, 2], score, .6, label="score", color='r')
pl.xticks([0, 1, 2], clf_names)

pl.show()

Script output:
________________________________________________________________________________
Ridge Classifier

error:   0.098
top 10 keywords per class:
alt.atheism: rushdie wingate osrhe atheist okcforum caltech islamic keith atheism atheists
comp.graphics: video format card looking hi 3d file image thanks graphics
sci.space: digex flight shuttle launch pat moon sci orbit nasa space
talk.religion.misc: jesus mitre hudson morality 2000 biblical beast mr fbi christian

                    precision    recall  f1-score   support

       alt.atheism       0.86      0.84      0.85       319
     comp.graphics       0.92      0.98      0.95       389
         sci.space       0.95      0.95      0.95       394
talk.religion.misc       0.84      0.78      0.81       251

       avg / total       0.90      0.90      0.90      1353

confusion matrix:
[[269   6   9  35]
 [  1 382   3   3]
 [  1  17 376   0]
 [ 41   9   6 195]]

________________________________________________________________________________
kNN

error:   0.144
                    precision    recall  f1-score   support

       alt.atheism       0.78      0.90      0.84       319
     comp.graphics       0.89      0.89      0.89       389
         sci.space       0.90      0.91      0.90       394
talk.religion.misc       0.86      0.67      0.75       251

       avg / total       0.86      0.86      0.86      1353

confusion matrix:
[[287   3  11  18]
 [ 14 348  19   8]
 [  7  26 359   2]
 [ 59  13  12 167]]


error:   0.117
top 10 keywords per class:
alt.atheism: god say think people don com nntp host posting article
comp.graphics: like com article know thanks graphics university nntp host posting
sci.space: nasa like university just com nntp host posting space article
talk.religion.misc: think know christian posting god people just don article com

                    precision    recall  f1-score   support

       alt.atheism       0.83      0.88      0.86       319
     comp.graphics       0.88      0.96      0.92       389
         sci.space       0.94      0.91      0.92       394
talk.religion.misc       0.87      0.73      0.79       251

       avg / total       0.88      0.88      0.88      1353

confusion matrix:
[[282   9   3  25]
 [  1 373  13   2]
 [  5  31 358   0]
 [ 50  10   8 183]]
Total running time of the example: 10.12 seconds


