Python source code: plot_random_hist.py
import random
L = []
random.seed('noyau')
for i in range(10000):
a = random.random()
L.append(a)
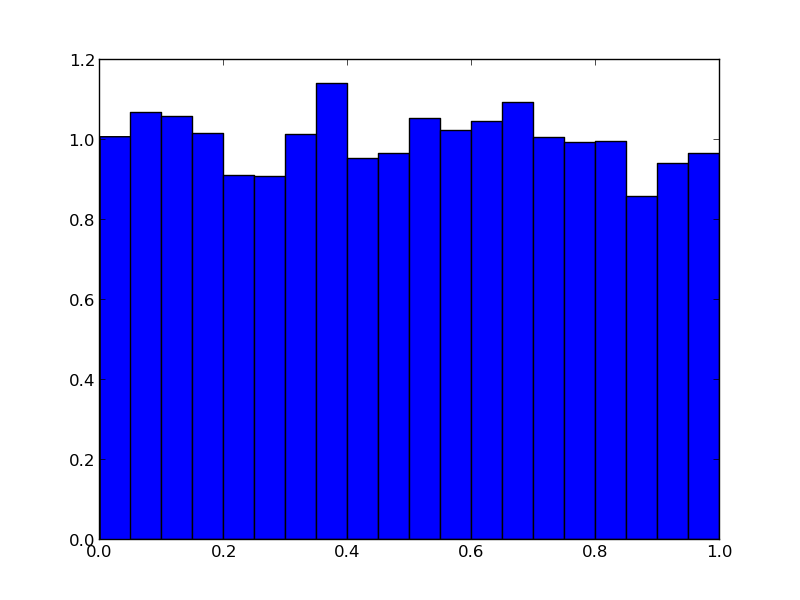
plt.hist(L,20,normed='True')
plt.savefig('W_random_hist.png')
plt.show()
Total running time of the example: 0.00 seconds