Python source code: plot_numpy_interaction.py
import matplotlib.pyplot as plt
import skimage
from skimage import data
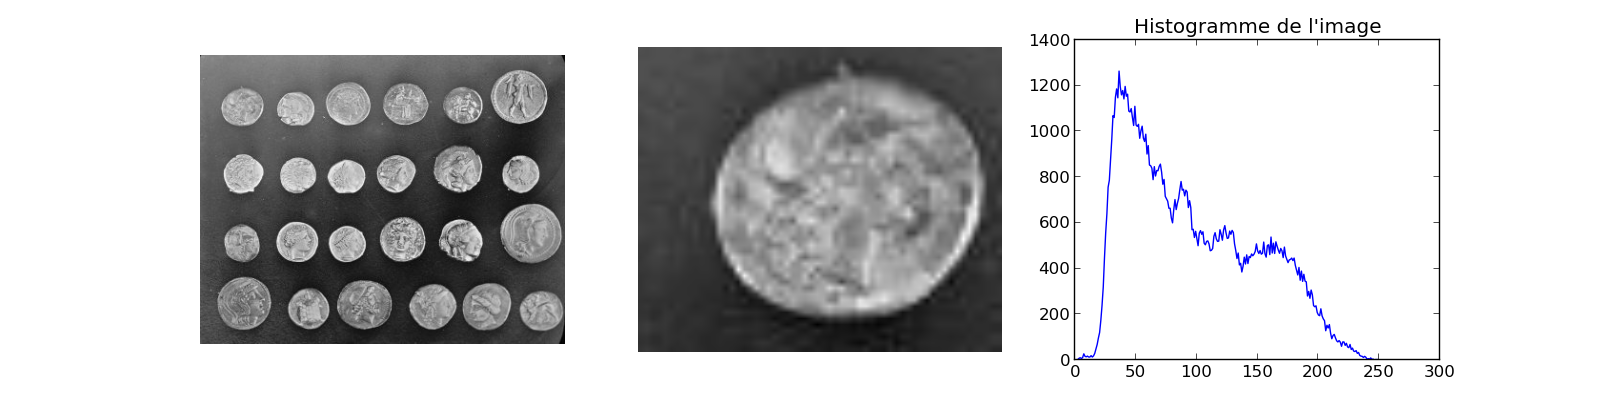
coins = data.coins()
detail = coins[30:80, 10:70]
values, bins = np.histogram(coins, bins=np.arange(256))
plt.figure(figsize=(16, 4))
plt.subplot(131)
plt.imshow(coins, cmap='gray')
plt.axis('off')
plt.subplot(132)
plt.imshow(detail, cmap='gray')
plt.axis('off')
plt.subplot(133)
plt.plot(bins[:-1], values)
plt.title('Histogramme de l\'image')
plt.show()
Total running time of the example: 0.00 seconds