Python source code: plot_intro.py
from skimage import data, filter
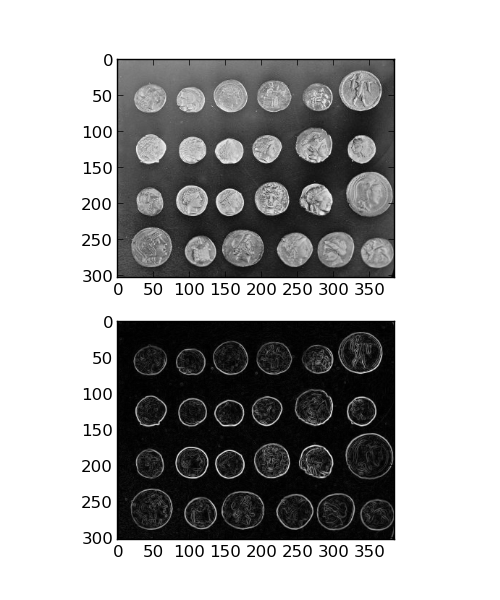
image_array = data.coins() # or any NumPy array!
edges = filter.sobel(image_array)
plt.figure(figsize=(5, 6))
plt.subplot(211)
plt.imshow(image_array, cmap='gray')
plt.subplot(212)
plt.imshow(edges, cmap='gray')
plt.show()
Total running time of the example: 0.00 seconds