Python source code: plot_simple_pendulum.py
import matplotlib.pyplot as plt
from scipy.integrate import odeint
def simple_pendulum(theta_thetadot, t):
theta, theta_dot = theta_thetadot
return [theta_dot, - np.sin(theta)]
theta_thetadot = (np.pi / 3, 0)
t = np.linspace(0, 5 * np.pi, 1000)
sol = odeint(simple_pendulum, (np.pi/3, 0), t)
theta, theta_dot = sol.T
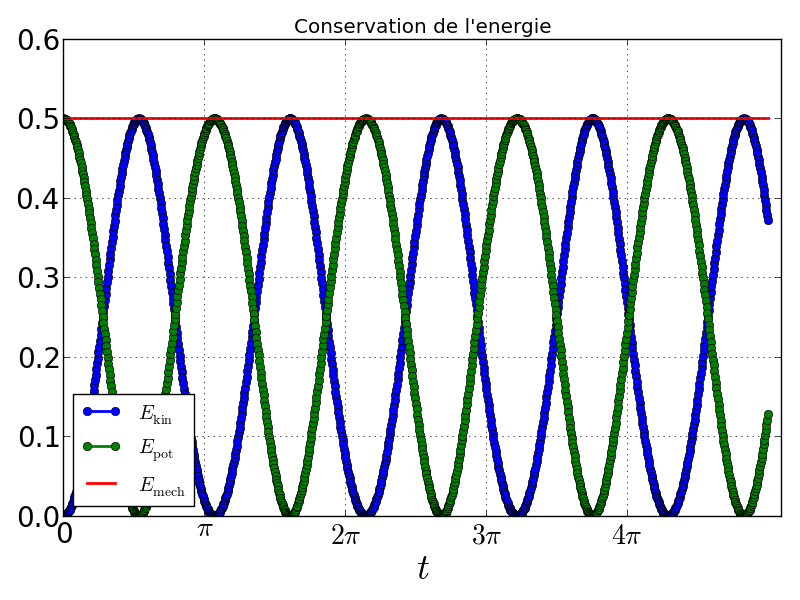
E_kin = 1./ 2 * theta_dot ** 2
E_pot = 1 - np.cos(theta)
E_mech = E_kin + E_pot
plt.figure()
ax = plt.gca()
plt.plot(t, E_kin, 'o-', lw=2, label=u'$E_\mathrm{kin}$')
plt.plot(t, E_pot, 'o-', lw=2, label=u'$E_\mathrm{pot}$')
plt.plot(t, E_mech, lw=2, label=u'$E_\mathrm{mech}$')
plt.xticks(np.pi * np.arange(5), [0, u'$\pi$', u'$2\pi$', u'$3\pi$', u'$4\pi$'])
plt.xlabel(u'$t$', fontsize=26)
plt.title(u'Conservation de l\'energie')
plt.gca().tick_params(axis='both', which='major', labelsize=20)
plt.legend(loc='best')
plt.grid()
plt.tight_layout()
plt.show()
Total running time of the example: 0.00 seconds