Python source code: plot_phase_diagram.py
import matplotlib.pyplot as plt
from scipy.integrate import odeint
def simple_pendulum(theta_thetadot, t):
theta, theta_dot = theta_thetadot
return [theta_dot, - np.sin(theta)]
t = np.linspace(0, 5 * np.pi, 1000)
theta_init = np.linspace(0, np.pi, 20)
plt.figure(figsize=(6, 6))
for theta_0 in theta_init:
theta, theta_dot = odeint(simple_pendulum, (theta_0, 0), t).T
plt.plot(theta, theta_dot)
plt.xlabel(u'$\\theta$', fontsize=26)
plt.ylabel(u'$\dot{\\theta}$', fontsize=26)
plt.axis('equal')
plt.xlim(-np.pi, np.pi)
plt.ylim(-2, 2)
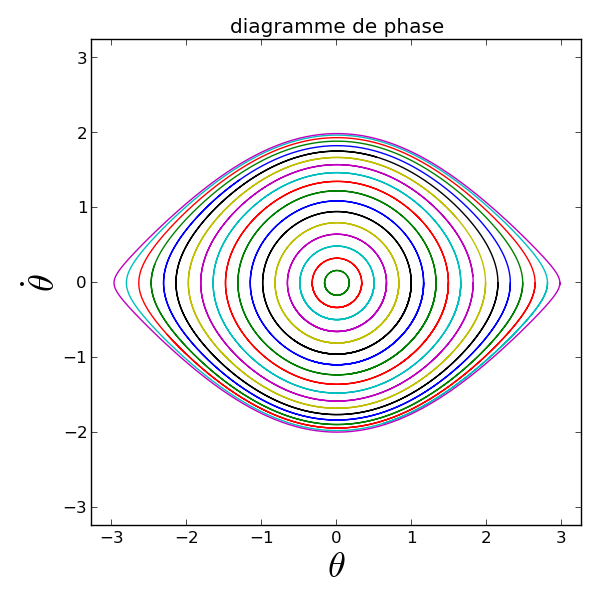
plt.title('diagramme de phase')
plt.tight_layout()
plt.show()
Total running time of the example: 0.00 seconds