Python source code: plot_chaos.py
import matplotlib.pyplot as plt
from scipy import fftpack
from scipy import signal
from dyna import forced_pendulum
omega = 2./3
dt = 2*np.pi / omega / 25
tf = 1000
acc = 1.17
eps = 1.e-8
all_theta_signals = []
t, theta_0, theta_dot_0 = forced_pendulum(tf, dt, np.pi/3, 0,
q=0.5, acc=acc, omega=omega)
t, theta_1, theta_dot_1 = forced_pendulum(tf, dt, (1 + eps) * np.pi/3, 0,
q=0.5, acc=acc, omega=omega)
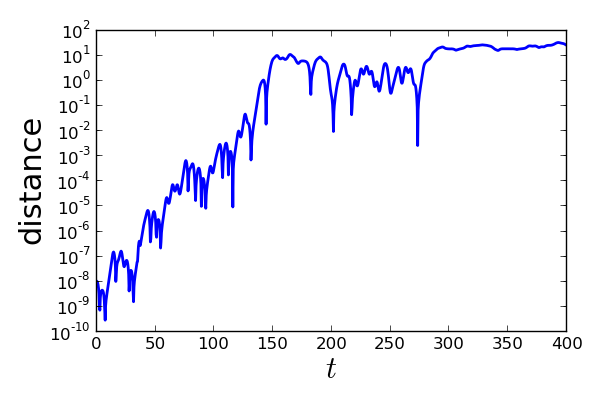
# Compute the distance between the two trajectories
dist = np.hypot(theta_1 - theta_0, theta_dot_1 - theta_dot_1)
plt.figure(figsize=(6, 4))
plt.semilogy(t, dist, lw=2)
plt.xlim(0, 400)
plt.xlabel(u'$t$', fontsize=22)
plt.ylabel('distance', fontsize=22)
plt.tight_layout()
plt.show()
Total running time of the example: 0.00 seconds