Python source code: plot_cascade.py
import matplotlib.pyplot as plt
fft_sig = np.load('fft_sig.npy')
plt.figure()
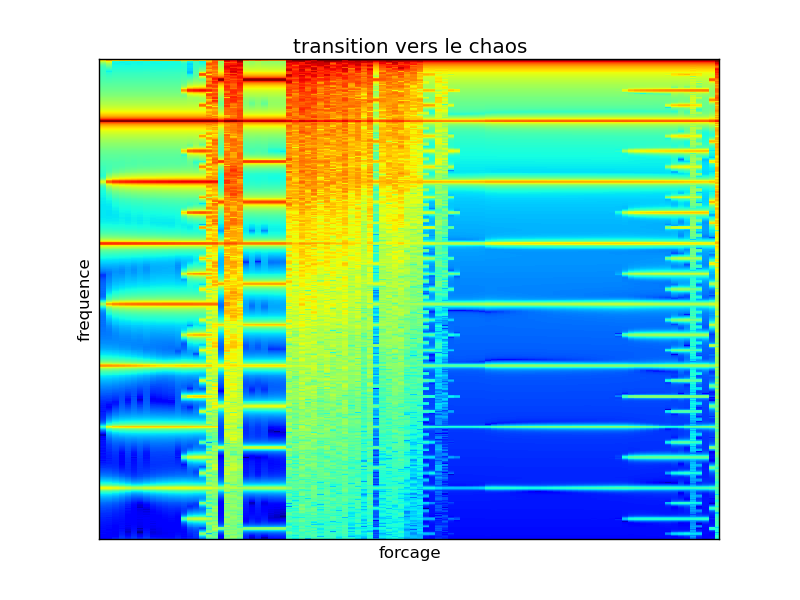
plt.imshow(np.log(np.abs(fft_sig[:, :500]).T), aspect='auto', interpolation='nearest')
plt.xlabel('forcage')
plt.ylabel('frequence')
plt.xticks([])
plt.yticks([])
plt.title('transition vers le chaos')
plt.show()
Total running time of the example: 0.00 seconds