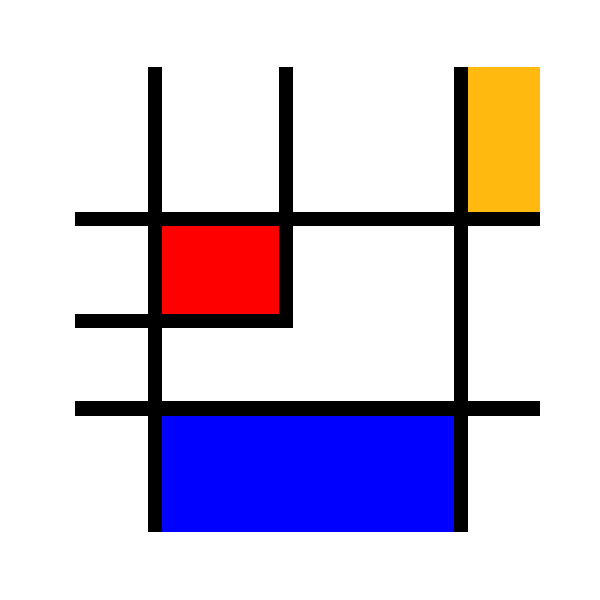
Un mini Mondrian
Python source code: plot_mini_mondrian.py
import matplotlib.pyplot as plt
import numpy as np

a = 255 * np.ones((32, 32, 3), dtype=np.uint8)

a[10] = 0
a[23] = 0
a[:, 5] = 0
a[:, 26] = 0
a[11:17, 6:14, 1:] = 0
a[:18, 14] = 0
a[17, :14] = 0
a[27:, 6:26, 0] = 0
a[27:, 6:26, 1] = 0
a[24:, 6:26, 1] = 0
a[24:, 6:26, 0] = 0
a[:10, 27:, 1] = 185
a[:10, 27:, 2] = 15
a[:10, 27:, 0] = 255

plt.figure(figsize=(6, 6))
plt.imshow(a, interpolation='nearest')
plt.axis('off')
plt.show()
Total running time of the example: 0.00 seconds