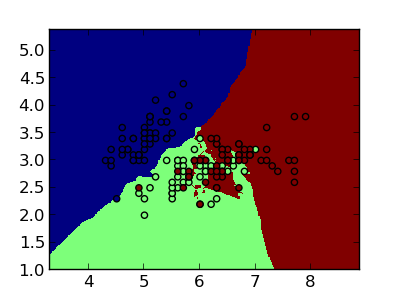
Predicteur au plus proche voisins
Ici, nous affichons les frontieres de decision en faisant la prediction sur une grille de point.
Python source code: plot_knn.py
import numpy as np
import pylab as pl
from sklearn import neighbors, datasets

iris = datasets.load_iris()
# We use only the 2 first features
data = iris.data[:, :2]
target = iris.target
h = .02 # step size in the mesh

# we create an instance of Neighbours Classifier and fit the data.
clf = neighbors.KNeighborsClassifier()
clf.fit(data, target)

# Plot the decision boundary. For that, we will asign a color to each
# point in the mesh [x_min, m_max]x[y_min, y_max].
x_min, x_max = data[:, 0].min() - 1, data[:, 0].max() + 1
y_min, y_max = data[:, 1].min() - 1, data[:, 1].max() + 1
xx, yy = np.meshgrid(np.arange(x_min, x_max, h), np.arange(y_min, y_max, h))
Z = clf.predict(np.c_[xx.ravel(), yy.ravel()])

# Put the result into a color plot
Z = Z.reshape(xx.shape)
pl.figure(1, figsize=(4, 3))
pl.clf()
pl.pcolormesh(xx, yy, Z)

# Plot also the training points
pl.scatter(data[:, 0], data[:, 1], c=target)
pl.xlim(xx.min(), xx.max())
pl.ylim(yy.min(), yy.max())
pl.show()
Total running time of the example: 1.61 seconds