Python source code: plot_granular.py
from skimage import io
from skimage import filter
from skimage import morphology
from skimage import segmentation
from skimage import measure
from skimage import draw
import matplotlib.pyplot as plt
import matplotlib.patches as mpatches

# Open image
# ----------------------------------------------

img = io.imread('../coins_black_small.jpg', as_grey=True)

# Binarize image
# ----------------------------------------------

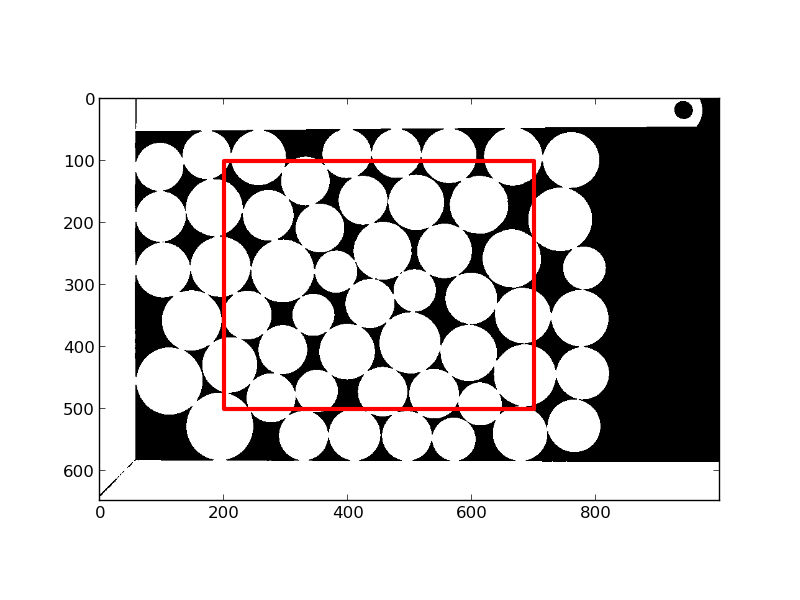
val = filter.threshold_otsu(img)

mask = img < val

plt.figure()
plt.imshow(mask, cmap='gray')
plt.gca().add_patch(mpatches.Rectangle((200, 100), 500, 400,
                                    ec=(1, 0, 0), fc='none', lw=3))

# Compute compacity of granular material
compacity = mask[100:500, 200:600].mean()


# Separate the different coins
# ------------------------------------------------

erosion = morphology.binary_erosion(mask, morphology.disk(9))
erosion = morphology.binary_erosion(erosion, morphology.disk(5))


labs = morphology.label(erosion, background=0)
labs += 1

from scipy import ndimage
elevation_map = - ndimage.distance_transform_edt(mask)

regions = morphology.watershed(elevation_map, markers=labs, mask=mask)

plt.figure(figsize=(12, 3))
plt.subplot(131)
plt.imshow(labs, cmap='spectral')
plt.axis('off')
plt.subplot(132)
plt.imshow(elevation_map, cmap='spectral')
plt.axis('off')
plt.subplot(133)
plt.imshow(regions, cmap='spectral')
plt.axis('off')
plt.tight_layout()

# remove borders and relabel regions
l0, l1 = img.shape
indices_borders = [regions[0, 0], regions[0, l1/2], \
                            regions[l0 - 1, l1/2]]

for index in indices_borders:
    regions[regions == index] = 0

seg, _, _ = segmentation.relabel_from_one(regions)

# Compute neighbors
# ------------------------------------------------------

neighbors = []

for lab in range(1, seg.max() + 1):
    dilation_of_region = morphology.binary_dilation(seg == lab,
                                morphology.diamond(3))
    neighbors.append(np.unique(seg[dilation_of_region]))

res = measure.regionprops(seg, ['Area', 'Centroid'])
areas = np.array([entry['Area'] for entry in res])
centroids = np.array([entry['Centroid'] for entry in res])

# Number of neighbors of each grain
# Remove 2 because the list of neighbors contains the index of the grain
# and the index of the background
number_of_neighbors = np.array([len(el) - 2 for el in neighbors])


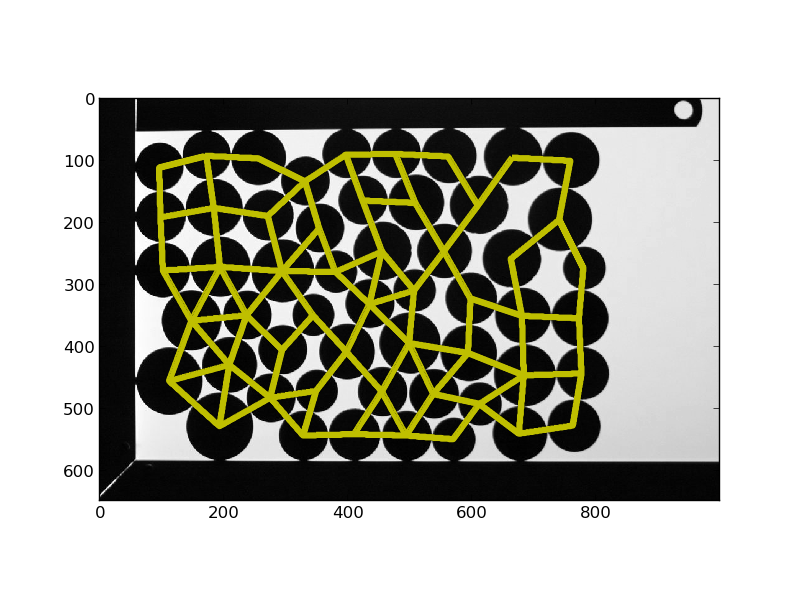
# Plot links between neighbors

new = np.zeros_like(img)

for lab_index, neighbors_index in enumerate(neighbors):
    true_neighbors = np.setdiff1d(neighbors_index, [0, lab_index + 1])
    x, y = centroids[lab_index]
    for element in true_neighbors:
        x1, y1 = centroids[element - 1]
        inds = draw.line(int(x), int(y), int(x1), int(y1))
        new[inds] = 1

plt.figure()
plt.imshow(img, cmap='gray', interpolation='nearest')
plt.contour(new, [0.5], linewidths=4, colors='y')
plt.show()
Total running time of the example: 0.00 seconds


